Native binary debugging for OCaml (written by Claude!)
Discuss on Hacker News, Twitter, Reddit or the OCaml forum.
Build your dreams and consider hiring me!
You might also enjoy AI will write your next compiler!
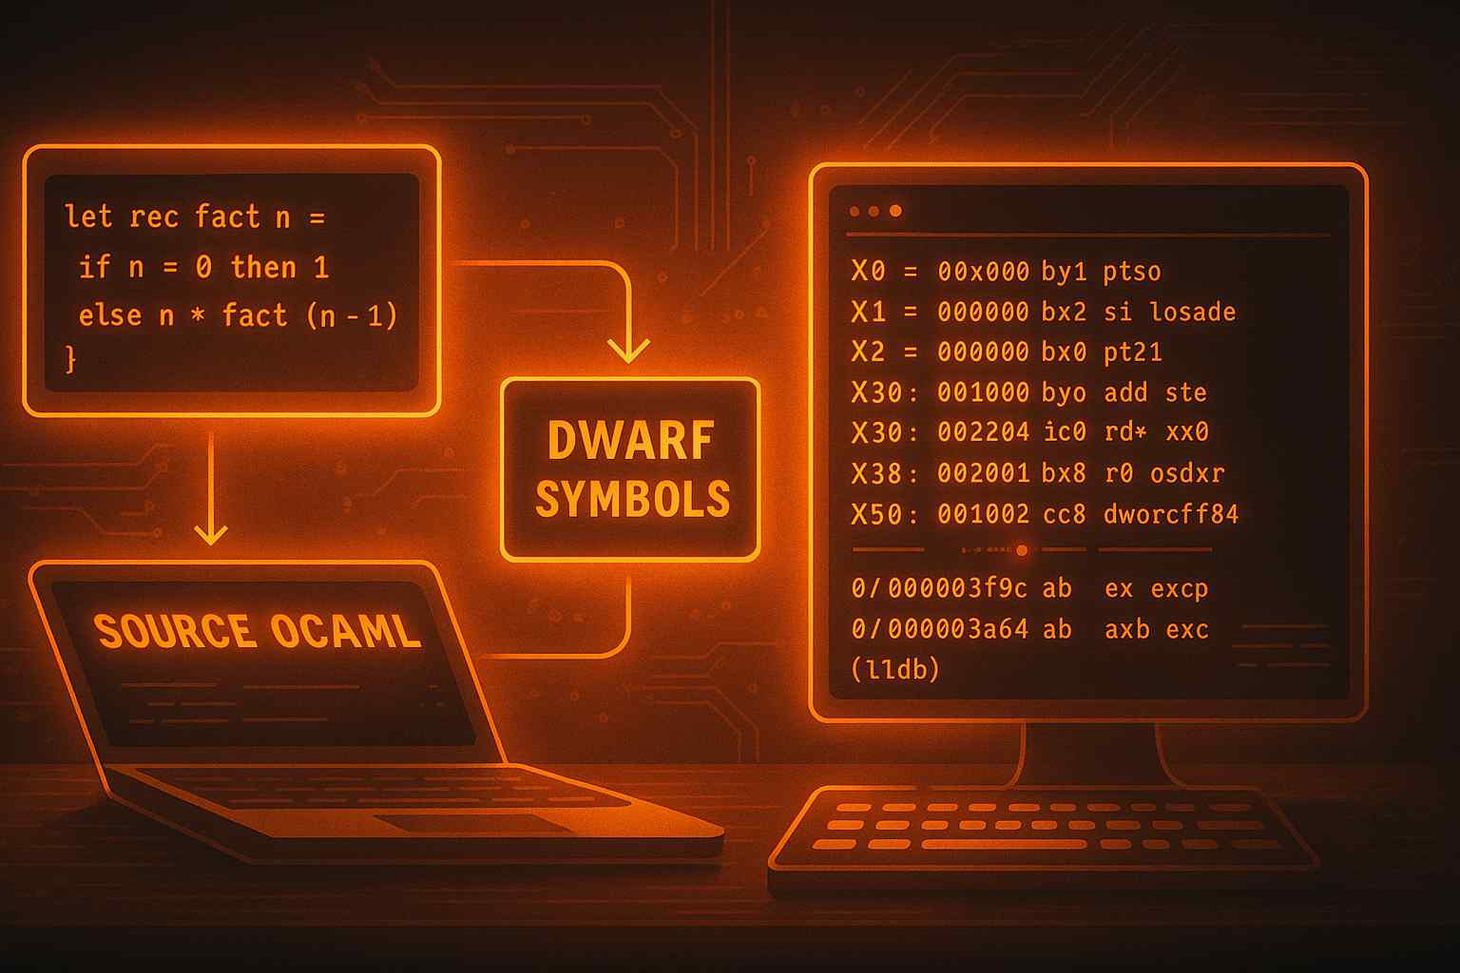
Debugging Native OCaml Code with DWARF
When you compile OCaml to native code and try to debug it, lldb can’t show you much: breakpoints don’t resolve, source lines don’t appear, and variable names look meaningless.
That’s not the debugger’s fault — it’s because the compiler didn’t emit debugging information. DWARF fixes that and this PR implements DWARF support for macOS and Linux.
What DWARF Does
DWARF is a standard format for debugging data. It tells your debugger where functions and variables are in memory and how they map back to source code. Without it, you get raw registers and disassembly. With it, you can step through code, inspect variables, and see your OCaml source while debugging.
The Change in OCaml
The stock OCaml compiler doesn’t generate DWARF data. Even with -g, native builds don’t include symbol or line information.
This new implementation adds DWARF v5 support, including real OCaml variable names. That means x, y, lst, acc, and total show up in LLDB instead of R0, R1, or nothing at all.
Example OCaml Program
let[@inline never] add x y =
  let total = x + y in
  total

let process_list lst =
  let rec sum acc = function
    | [] -> acc
    | head :: tail ->
        let new_acc = acc + head in
        sum new_acc tail
  in
  let total = sum 0 lst in
  let doubled = total * 2 in
  let message = Printf.sprintf "running total=%d" total in
  (total, doubled, message)

let numbers_data = [1; 2; 3; 4; 5]

let () =
  ignore (add 40 2);
  let numbers = Sys.opaque_identity numbers_data in
  let total, doubled, message = process_list numbers in
  Printf.printf "Total: %d double=%d %s\n" total doubled message
Sys.opaque_identity keeps the variable “alive” for the debugger; otherwise, the optimizer would inline the list and remove it.
Stock OCaml 5.3.0 (no DWARF)
$ ocamlopt -g -o demo demo.ml
$ dwarfdump --debug-info demo
.debug_info contents:
  (empty)
No debug info. LLDB can’t map code to source or find variable names.
DWARF-Enabled OCaml
$ ocamlopt -g -o demo demo.ml
$ dwarfdump --debug-info demo.o | grep -A3 "DW_TAG_formal_parameter"
0x00000095:     DW_TAG_formal_parameter
                  DW_AT_name  ("x")
                  DW_AT_type  (value)
                  DW_AT_location (DW_OP_reg0 W0)
Each parameter and local now has a name and location. You can inspect them directly in LLDB.
Debugging Example
1. Stock OCaml Build
We’ll start with a normal build (no DWARF) to show what doesn’t work.
$ lldb /tmp/blog_nodebug
(lldb) settings set interpreter.stop-command-source-on-error false
(lldb) target create /tmp/blog_nodebug
Trying to set a source-level breakpoint fails:
(lldb) br s -f /tmp/blog_demo.ml -l 12
Breakpoint 1: no locations (pending).
WARNING: Unable to resolve breakpoint to any actual locations.
Setting a breakpoint by symbol works:
(lldb) br s -n camlBlog_demo$process_list_279
Breakpoint 2: where = blog_nodebug`camlBlog_demo$process_list_279, address = 0x0000000100003b50
Running the program hits the symbol breakpoint but there’s no source mapping:
(lldb) run
Process 7003 launched: '/tmp/blog_nodebug' (arm64)
Process 7003 stopped
* thread #1, queue = 'com.apple.main-thread', stop reason = breakpoint 2.1
    frame #0: 0x0000000100003b50 blog_nodebug`camlBlog_demo$process_list_279
Listing source or printing variables doesn’t work:
(lldb) source list -f /tmp/blog_demo.ml -l 12
error: Could not find source file "/tmp/blog_demo.ml".
(lldb) p lst
error: use of undeclared identifier 'lst'
(lldb) p total
error: use of undeclared identifier 'total'
No variable or file information. LLDB can only show raw addresses.
2. DWARF-Enabled Compiler + LLDB Plug-in
Now let’s rebuild with DWARF and use the Python plug-in that knows how to read OCaml values.
Load the binary and the helper:
$ lldb /tmp/blog_demo
(lldb) settings set interpreter.stop-command-source-on-error false
(lldb) target create /tmp/blog_demo
(lldb) command script import tools/ocaml_lldb_plugin.py
OCaml LLDB helpers loaded (commands: ocaml_vars)
Set breakpoints by file and symbol:
(lldb) br s -f /tmp/blog_demo.ml -l 2
Breakpoint 1: where = blog_demo`camlBlog_demo$add_274, address = 0x0000000100003b30
(lldb) br s -n camlBlog_demo$add_274
Breakpoint 2: where = blog_demo`camlBlog_demo$add_274, address = 0x0000000100003b30
Run and inspect parameters:
(lldb) run
Process stopped at blog_demo.ml:2
(lldb) source list -f /tmp/blog_demo.ml -l 2
   1      let[@inline never] add x y =
-> 2        let total = x + y in
   3        total
(lldb) p x
x (param, dwarf=value, runtime=int) = int(40)
(lldb) p y
y (param, dwarf=value, runtime=int) = int(2)
Now variables are visible by name and type.
Inspect a local variable later in the file:
(lldb) br s -f /tmp/blog_demo.ml -l 21
Breakpoint 1: where = blog_demo`camlBlog_demo$entry + 160, address = 0x0000000100003d00
(lldb) run
Process stopped at blog_demo.ml:22
(lldb) source list -f /tmp/blog_demo.ml -l 21
   20      ignore (add 40 2);
-> 21      let numbers = Sys.opaque_identity numbers_data in
   22      let total, doubled, message = process_list numbers in
(lldb) p numbers
numbers (local, dwarf=value, runtime=list) = [int(1); int(2); int(3); int(4); int(5)]
And inside another function:
(lldb) br s -f /tmp/blog_demo.ml -l 12
(lldb) br s -n camlBlog_demo$process_list_279
(lldb) run
Process stopped at the start of process_list
(lldb) source list -f /tmp/blog_demo.ml -l 12
   11      in
-> 12      let total = sum 0 lst in
   13      let doubled = total * 2 in
(lldb) p lst
lst (param, dwarf=value, runtime=list) = [int(1); int(2); int(3); int(4); int(5)]
(lldb) p total
total (local, dwarf=value, runtime=list) = [int(1); int(2); int(3); int(4); int(5)]
Finally, dump all visible OCaml bindings:
(lldb) ocaml_vars
lst (param, dwarf=value, runtime=list) = [int(1); int(2); int(3); int(4); int(5)]
clos (local, dwarf=value, runtime=int) = int(2)
new_acc (local, dwarf=value, runtime=tuple[3]) = (<closure arity=2 env=1 code=0x1000037f8>, <closure arity=1 env=0 code=0x100003b50>, [int(1); int(2); int(3); int(4); int(5)])
total (local, dwarf=value, runtime=list) = [int(1); int(2); int(3); int(4); int(5)]
doubled (local, dwarf=value, runtime=tuple[13]) = (<closure …>, …)
arg (local, dwarf=value, runtime=list) = [int(1); int(2); int(3); int(4); int(5)]
message (local, dwarf=value, runtime=list) = [int(1); int(2); int(3); int(4); int(5)]
Now breakpoints resolve, source lines show up, and variable values are readable.
How the Plug-in Works
The LLDB Python plugin parses DWARF location lists emitted by the compiler. It tracks where each OCaml variable lives (register or stack), decodes heap objects, and displays lists, tuples, closures, and constants in a human-readable form.
If p doesn’t work, ocaml_vars will still print everything in scope.
Supported Features
- Source and line mapping
- Function and variable names
- Stack traces through OCaml frames
- OCaml type detection and printing
- Pretty-printing of lists, tuples, closures, etc.
Missing Features
- Records and variants show as tuples
frame variabledoesn’t show OCaml bindings
Still, it’s much easier than debugging raw assembly.
Platform Support
- macOS / Linux: works with DWARF v5
- Other platforms: explicitly disabled
Installation
git clone https://github.com/joelreymont/ocaml.git
cd ocaml
git checkout dwarf
./configure && make world.opt
./ocamlopt.opt -g yourcode.ml -o yourprog
lldb yourprog
LLDB Quick Reference
# Set breakpoint by file and line
b -f yourfile.ml -l N

# Or by function
b -n camlYourmodule$yourfunction_*

# Run program
run

# Print OCaml locals
p var
ocaml_vars

# Backtrace
bt

# Step and continue
si
continue
Python Plug-in Setup
(lldb) command script import /path/to/project/tools/ocaml_lldb_plugin.py
OCaml LLDB helpers loaded (commands: ocaml_vars)
Make it permanent by adding this line to ~/.lldbinit:
command script import ~/.lldb/ocaml_lldb_plugin.py
On macOS, run dsymutil yourprog so that DWARF data is stored in .dSYM. On Linux, it’s embedded directly in the ELF binary.
Example Session
$ lldb /tmp/blog_demo
(lldb) command script import tools/ocaml_lldb_plugin.py
(lldb) br s -n camlBlog_demo$process_list_279
(lldb) r
(lldb) ocaml_vars
lst (param, dwarf=value, runtime=list) = [int(1); int(2); int(3); int(4); int(5)]
fun (local, dwarf=value, runtime=closure) = <closure arity=1 env=0 code=0x100003b50>
message (local, dwarf=value, runtime=list) = [int(1); int(2); int(3); int(4); int(5)]
With DWARF and the LLDB plug-in, OCaml native debugging finally works like in other compiled languages: real variable names, readable values, and working source-level breakpoints.
How did I do it?
I did not write a single line of code but carefully shepherded AI over the course of several days and kept it on the straight and narrow.
- AI: I need to keep track of variables moving across registers. This is too hard, let’s go shopping…
- Me: Hey, don’t any no shortcuts!
My work was just directing, shaping, cajoling and reviewing!
)

The Zen of Coding Newsletter
Join the newsletter to receive the latest updates in your inbox.